Go runtime vs CFS quota
As of today, the Go runtime isn’t aware if it runs inside a container under the resource constraints (CPU or memory). The runtime sees the resources available for the container’s underlying host OS, e.g. the VM where the container runs, and tries to optimize its behaviour base on what it sees. For container runtimes on Linux, which implements the CPU restrictions via CFS (“Completely Fair Scheduler”), a mismatch in what the application thinks is has, and what the OS allows to use, can lead to the poor performance of the application after the unexpected throttling.
For example, a Go application, that runs in a container, constrained with 0.5 CPU, running on a host with 2 CPU, will observe 2 available CPU cores. That is the application’s calls to runtime.NumCPU() and runtime.GOMAXPROCS() will get us “2”. Because the Go runtime is optimized for the maximum utilization of the available compute under the concurrent workload, the goroutines it spawns are distributed to the internal thread pool, created with the assumption of two available CPU cores. This causes the application to throttle after the sum of the time it spend on the CPU cores per CFS period become equals to the quota of the container. With the default CFS period 100ms, the CFS quota of this container 0.5 CPU, and two threads running on different CPU cores, the application is throttled after 25ms every 100ms.
Go project has an old proposal to make its runtime CFS-aware with more examples in the comments.
Let’s observe this behaviour with a simple Go application:
func main() {
	done := make(chan struct{})

	go work()
	go work()

	fmt.Println("Started")
	<-done
}

func work() {
	for {
		os.ReadFile("/etc/passwd")
	}
}
We will start the app in a docker container (for all examples here, docker runs inside a Linux VM with 2 vCPU):
% docker container run --rm -ti test-go-cpu-throttle
Started
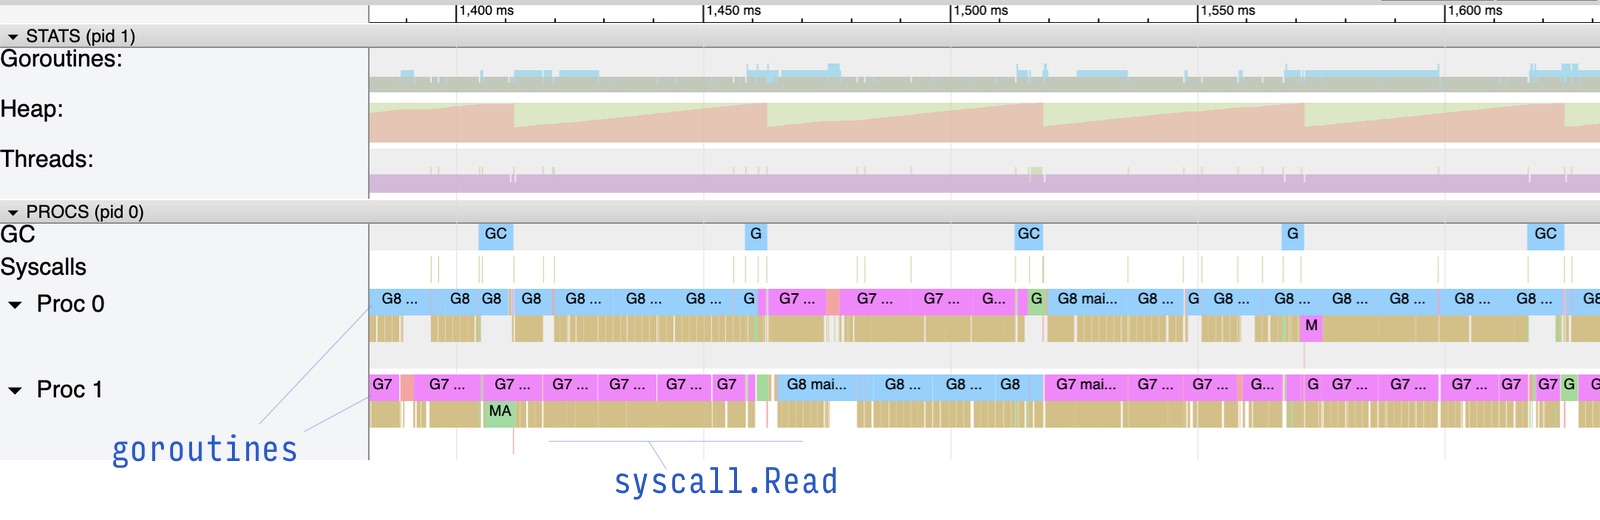
We collect the Go runtime trace from the app to observe that both “work” goroutines are scheduled onto the two available procs (P threads), and keep the CPU busy, executing the Read syscalls (tiny orange lines below the coloured bars with the goroutines):
Now, for the experiment, let’s restrict the container with only 0.5 CPU:
% docker container run --cpus 0.5 --rm -ti test-go-cpu-throttle
Started
The runtime trace shows that the goroutines on both Ps execute the Read syscalls for 25ms, and then for 75ms the goroutines did nothing. Then they executed another bunch of syscalls for 25ms, followed by another 75ms of no work:
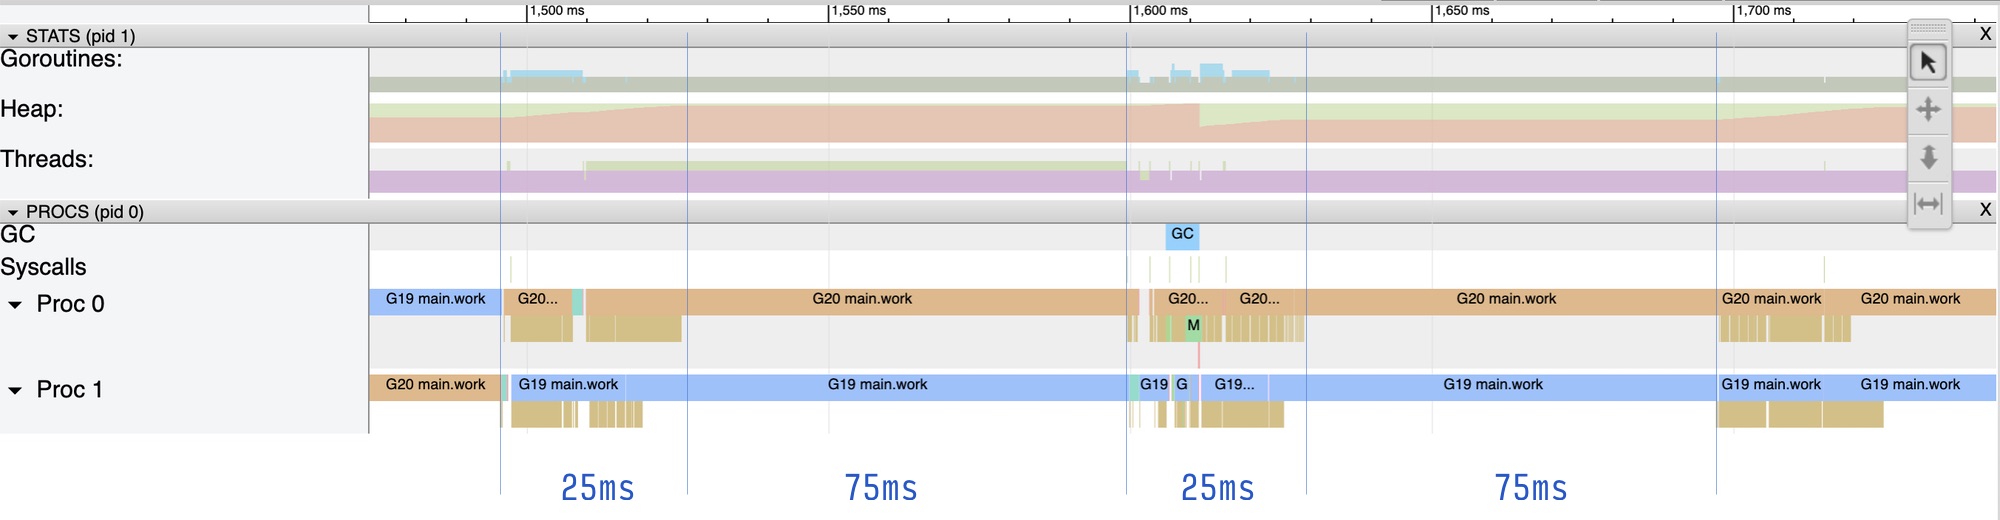
Note that this simple experiment also shows that Go runtime can’t tell us when the application was put off the CPU (i.e. throttled). The runtime trace above shows that for 75ms the goroutines were running but didn’t execute any syscalls. This observation explains why our test application uses os.ReadFile: this is so we could clearly differentiate from the trace the period when the application actually ran the workload, by observing the executed syscalls, which read a file.
As I mentioned above, the observed behaviour may be unexpected and not ideal for some workloads, especially with lower CFS quotas. Even though, the app spent total 50ms on the CPU (25ms * 2 cores), it throttled for 75ms, per one CFS period. An HTTP server, that runs in a small container with 0.1 or 0.25 CPU, on a multicore host system, will see this as the elevated tail latency in the handling of the requests.
Until Go becomes CFS aware one day (like JVM), the way to improve the situation is via fine-tuning GOMAXPROCS, overwriting its default value, to align with what amount of CPU is available to the container.
The automaxprocs package is a convenient way to do that:
import (
	_ "go.uber.org/automaxprocs"
)
Let’s run the updated version of the app in a container, still restricting it with only 0.5 CPU:
% docker container run --cpus 0.5 --rm -ti test-go-cpu-throttle
2023/01/11 19:05:07 maxprocs: Updating GOMAXPROCS=1: using minimum allowed GOMAXPROCS
Started
Observe that automaxprocs updated the GOMAXPROCS to 1 (the allowed minimum), restricting the application with only one CPU core.
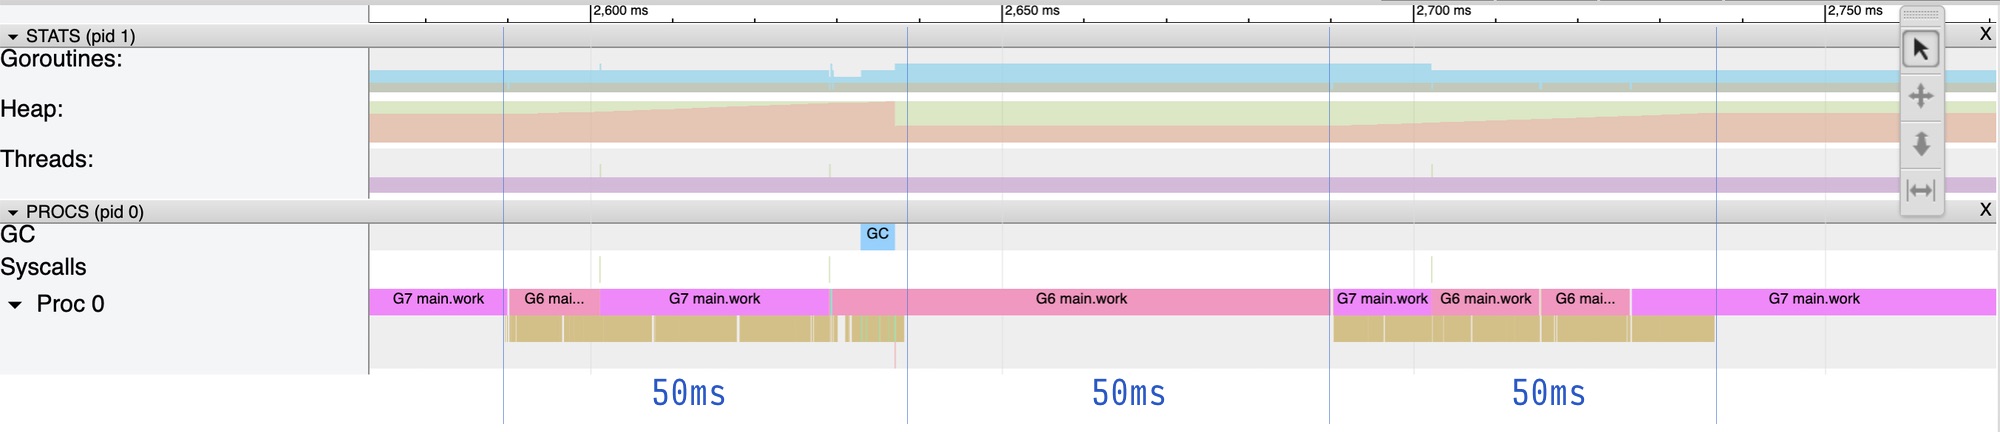
The runtime trace now shows that the goroutines run on the single available proc, firing the Read syscalls for 50ms, and then do no work for the 50ms, just like we may expect for this quota:
Update 2023-05: for workloads running on Kubernetes, you can also set GOMAXPROCS directly in the yaml manifest, deriving the correct value from the container’s resource limits. I find this especially handy, when injecting an extra dependency, like “automaxprocs”, isn’t an option for the deployment. The “Env variables, you will (likely) find set in my Kubernetes deployments” note shows how this works.
Update 2025-04: Michael Pratt opened a new concrete proposal to the Go runtime to make the default GOMAXPROCS CPU limit-aware.
For such a naive test application, the difference in the behaviour may not play a big role (if any at all). But, generally, such change makes the application’s performance more predictable, when we deploy Go applications in a container runtime, e.g. with Kubernetes, ECS, AWS Lambda, etc.
Let’s discuss the note on Reddit or Hacker News.